A Practical Guide to Analyze Any Stock (With Examples)
Investing in stocks can seem overwhelming, especially with the sheer amount of information available. Many resources provide a general overview but often lack practical, detailed guidance. This guide aims to bridge that gap by offering a clear, step-by-step approach to stock analysis, complete with real-world examples.
The goal is to demonstrate that you don’t need a PhD in finance to effectively analyze stocks. By focusing on a few key graphs and numbers, anyone can gain valuable insights into a company’s potential. This guide is designed to be comprehensive yet concise, so you can absorb the information at your own pace.
Stock analysis can be distilled into four essential steps:
- Understanding the Business: Grasp the core operations and products and services of the company.
- Analyzing Fundamentals: Examine financial metrics to assess the company’s financial health & trajectory.
- Evaluating Qualitative Aspects: Consider the company's strategy, competitive advantage, and management quality.
- Buying at the Right Price: Determine if the stock is priced appropriately based on its intrinsic value and market conditions.
Understanding the Business
Understanding a new business starts with gathering basic information about its operations, products, and services. Here are some steps to get you started:
- Read the Company’s Profile
-
Visit the company’s website to explore its offerings and market positioning.

-
- Review the 10-K Annual Report
-
This report provides a comprehensive overview of the business, including its history, structure, and strategy.

Item 1. Business in a 10-K Annual Report contains an overview.
-
- Leverage AI for Summarization
-
For an alternative approach, use AI tools to summarize key information about the company.

-


Once you have a sense of what the business does, the next step is to assess its fundamentals.
Fundamental Analysis
Before diving into the specifics, it’s essential to understand the key indicators we’re looking for:
- Business Growth: We want to see consistent growth in the company’s revenue, earnings, assets and free cash flow.
- Stable and Predictable Earnings: Look for earnings that are not only growing but also stable and predictable over time.
- Returns on Capital: Assess how efficiently the company uses its capital to generate earnings. This indicates the profitability and quality of the business.
- Free Cash Flow (FCF): Evaluate how much of the earnings can be taken out by business owners. This involves looking beyond just earnings to also consider the free cash flow.
Earnings & Revenue
Understanding earnings and revenue is crucial for analyzing any stock. Earnings, also known as net income, represent the bottom line of a company’s financial statement. Here’s what you should look for:
Ideal Scenarios
- Consistent Growth
- Top Line or Revenue: Steady growth in overall revenue that reliable
- Bottom Line Earnings Per Share (EPS: Stready growth in net income per share
-

Microsoft is a great example of consistent growth in EPS - Explosive Growth

-
Companies experiencing rapid revenue and earnings growth.

Nvidia demonstrating its explosive growth

Scenarios to Avoid
- Declining Growth:
- Decreasing revenue and earnings.
-

Intel's earnings has declined significantly

- No or Negative Earnings
-


Nuanced Scenarios
- Reduced Growth:
- Initial high growth that slows over time.
- Example: Tesla (TSLA) (Despite reduced growth, Tesla’s revenue has actually increased.)
-

Tesla's earnings have contracted -

While its Revenue has increased


- Flip to Profitability:
- Transitioning from losses to profits.
- Example: TransMedics Group (TMDX)
-

TransMedics has become profitable

- Flip to Non-Profitability:
- Transitioning from profits to losses.
- Example: Micron Technology (MU)
-

Micron Technology went from positive to negative to positive EPS

Market Sensitivity to Earnings
It’s important to note that market prices are very sensitive to earnings results. A significant example is how the market reacts when a company’s earnings miss estimates. This can lead to substantial price volatility.
-

Notice how MercadoLibra's Earnings came in well below the estimate -

The earnings came out on 22 Feb -

Now notice how the price declined after MELO misses its earnings estimate.


Evaluating Margins to Assess the Business Quality
Evaluating profit margins and returns on capital is essential for understanding a company's efficiency in generating profits from its investments.
First, let's see how much of the revenue results into the net income? This is also called the net profit margin.


What constitutes a good net profit margin? To provide context, the average net profit margin for companies in the S&P 500 is currently around 12.7%.

For a more detailed analysis, consider examining additional profitability metrics:
- Operating Margin: This metric focuses on the profitability of the company's core business operations, excluding interest and taxes.
- EBITDA Margin: Reflects earnings before interest, taxes, depreciation, and amortization, providing insight into the company's operational profitability before accounting for non-cash expenses.
- Gross Profit Margin: Measures the margin on the products or services sold, highlighting the efficiency of production and sales processes.
Each of these metrics offers a different perspective on a company’s profitability, helping you gain a more comprehensive understanding of its profitability.
Evaluating Returns to Determine Business Quality
To assess the quality of a business, it's essential to consider how much capital is needed to generate its yearly net income.
Return on Equity (ROE)
For example, if a company generates $20 million in net income with total equity of $10 million, the return on equity (ROE) would be 2x or 200%. The higher the number, the stronger the efficiency in using shareholders' equity to produce profits.
ROE is particularly useful for understanding the efficiency of companies. However, young companies often have higher equity compared to liabilities (debt), while mature companies like Apple or Coca-Cola typically have lower equity relative to their liabilities.
Return on Invested Capital (ROIC)
To gain a more comprehensive understanding, consider the Return on Invested Capital (ROIC), which takes into account both equity and debt. ROIC provides a clearer picture of a company's overall efficiency in generating returns from its total capital base.
Example of an Efficient Business
Let's examine Apple as an example of a very efficient business. Apple consistently demonstrates high ROE and ROIC, reflecting its ability to generate substantial returns from its invested capital.


The Different Return Metrics
Return on Equity = Net Income / Equity
Return on Assets = Net Income / Assets
Return on Capital Employed = EBIT / Assets - Current Liabilities
Return on Invested Capital = NOPAT (or EBIAT) / Assets - Cash - Current Liabilities

Free Cash Flow
Now, let's examine how earnings translate into free cash flow (FCF). Jeff Bezos, once the richest man in the world, has emphasized that the most important metric is free cash flow per share.
Calculating Free Cash Flow
To calculate free cash flow:
- Start with Net Income
- Begin with the net income.
- Adjust for Operating Cash Flow
-
Make adjustments to obtain the operating cash flow.

-
- Subtract Capital Expenditures (CapEx)
-
Deduct capital expenditures from the operating cash flow to determine the free cash flow.

-


Example: Amazon
Consider Amazon's financials. In 2022, Amazon experienced a dip in free cash flow. This decline was due to decreased operating cash flow combined with high capital expenditures.
In such situations, it's crucial to understand the reasons behind the high capital expenditures. In Amazon's case, a significant portion of the CapEx was its investments in property plant and equipment. This suggests that Amazon was reinvesting heavily into its own business, which could be a positive indicator for future growth.

Understanding Outstanding Shares and Float Shares
Additionally, it's important to understand what a company is doing with its shares. If a company is continuously issuing shares, then you as an investor will get diluted and the earnings per share will contract. Conversely it's positive when a company is doing buy-backs, as this will increase your share of the pie.


Typically, for companies that have a smaller market cap there's another risk: a low shares float compared to the shares outstanding. With fewer shares available, stock prices can be more volatile, experiencing larger swings in response to market demand.

Alternatively: Use Streamlined's Quantitative Scoring
Many of the factors considered above are taken into account in Streamlined’s quantitative scoring. It essentially does the work for you as it takes into account multiple factors.


Qualitative Analysis
To gain a deeper understanding of a company's strategy and business outlook, it's essential to look beyond financial statements and analyze qualitative factors. Here’s how to approach it:
Key Sources for Qualitative Insights
- Press Releases:
- Partnerships and Collaborations: Press releases often highlight new partnerships or collaborations, which can indicate strategic moves and growth opportunities.
- Corporate Actions: Announcements such as stock splits or leadership changes provide insights into the company’s future direction and management focus.
- SEC Filings:
- Reports and Filings: Annual and quarterly reports filed with the SEC, such as 10-Ks and 10-Qs, contain detailed information about the company’s strategy, performance, and outlook.
- AI Generated Qualitative Analysis
- Business Intro: AI can summarize the company’s mission, vision, and key value propositions.
- Business Overview: Provides a detailed analysis of the company’s operations, products, and market position.
- Business Risks: Identifies potential risks and challenges the company may face, including market, operational, and financial risks.
- Business Outlook: Offers predictions and future trends based on current data and market conditions.
- Management’s Analysis: Analyzes statements and reports from management to understand their strategic vision and management style.
- Competitors: Compares the company’s performance and strategy with key competitors in the industry.
- Earnings Guidance: Summarizes management’s earnings forecasts and expectations for future financial performance.
Press Releases Examples
-

Frontdoor's change in leadership

-

Palentir announces a new partnership -

Tesla announces a 3:1 stock split


Reports Examples
-

From Tesla's 8-K Current Report 
From Palentir's 8-Q Quarterly Report -

Expansion plans from its 8-Q report


AI Generated Qualitative Analysis Examples


Buying at the Right Price
Once you’ve determined that a company is a good investment based on previous analyses, the next step is to buy it at the right price. To achieve this, consider two main factors:
- Valuation: Determine if the stock is fairly valued relative to its financial performance and growth potential. The best metrics for this are the P/E ratio that compares the price with the earnings and the P/S ratio that compares the price with the sales (or revenue).
- Technical Entry Point: Identify the optimal time to buy based on technical indicators and market trends.
Understanding Valuation
Before diving into valuation, it’s important to recognize that high market capitalization and growth stocks often come with higher valuations.
This is because the market determines the price based on the future earnings of a company, which will be higher than the current earnings.
On top of that, stocks are liquid assets, meaning that investors can buy and sell them at any time. This makes it acceptable for a fund to buy an asset at a current premium if it expects that the price will follow the earnings growth at a continued elevated premium since it could simply sell it at any time. This makes it more of a speculative trade than an investment, but it is what is it.

The lesson here is that you only look at P/E or P/S ratio's you might miss out, but beware that whenever the earnings growth decelerates, the valuation will contract as all that speculative money will move to other growth assets.
Similarly, high market capitalization stocks are valued higher due to the liquidity needs of large funds, such as the Norwegian sovereign wealth fund. These funds prefer large-cap stocks because selling substantial positions in smaller companies could significantly impact the stock price. As a result, they focus on high market cap stocks to minimize this risk. Therefore, when evaluating a smaller company with a low P/E ratio, it's important to remember that this cannot be directly compared to the valuation of large-cap stocks like Microsoft or Apple.


Discounted Cash Flow (DCF) Analysis
So far we have discussed valuation as a metric (P/E & P/S ratio). But you can also calculate the intrinsic value using the Discounted Cash Flow Analysis. This method values a company based on its expected future free cash flows (FCFs). The DCF model consists of two stages:
- Initial Stage: Forecast FCFs for a period of five years, where predictions are more reliable.
- Terminal Stage: Estimate the company’s value beyond the forecast period.
Using tools like Streamlined Finance, you can adjust projected FCFs, the cost of capital, and calculate the company's long-term value to derive the value per share.

And in the second stage, you can calculate the cost of capital and the long term value.

The Right Technical Entry Point
Let's say that now you've decided to buy a stock, the final thing to do is to watch it's trend-lines, support and resistance zones and it's moving averages. Each of these could provide a great entry point to take a position.
-

Buy at the bottom of the trend-line

-
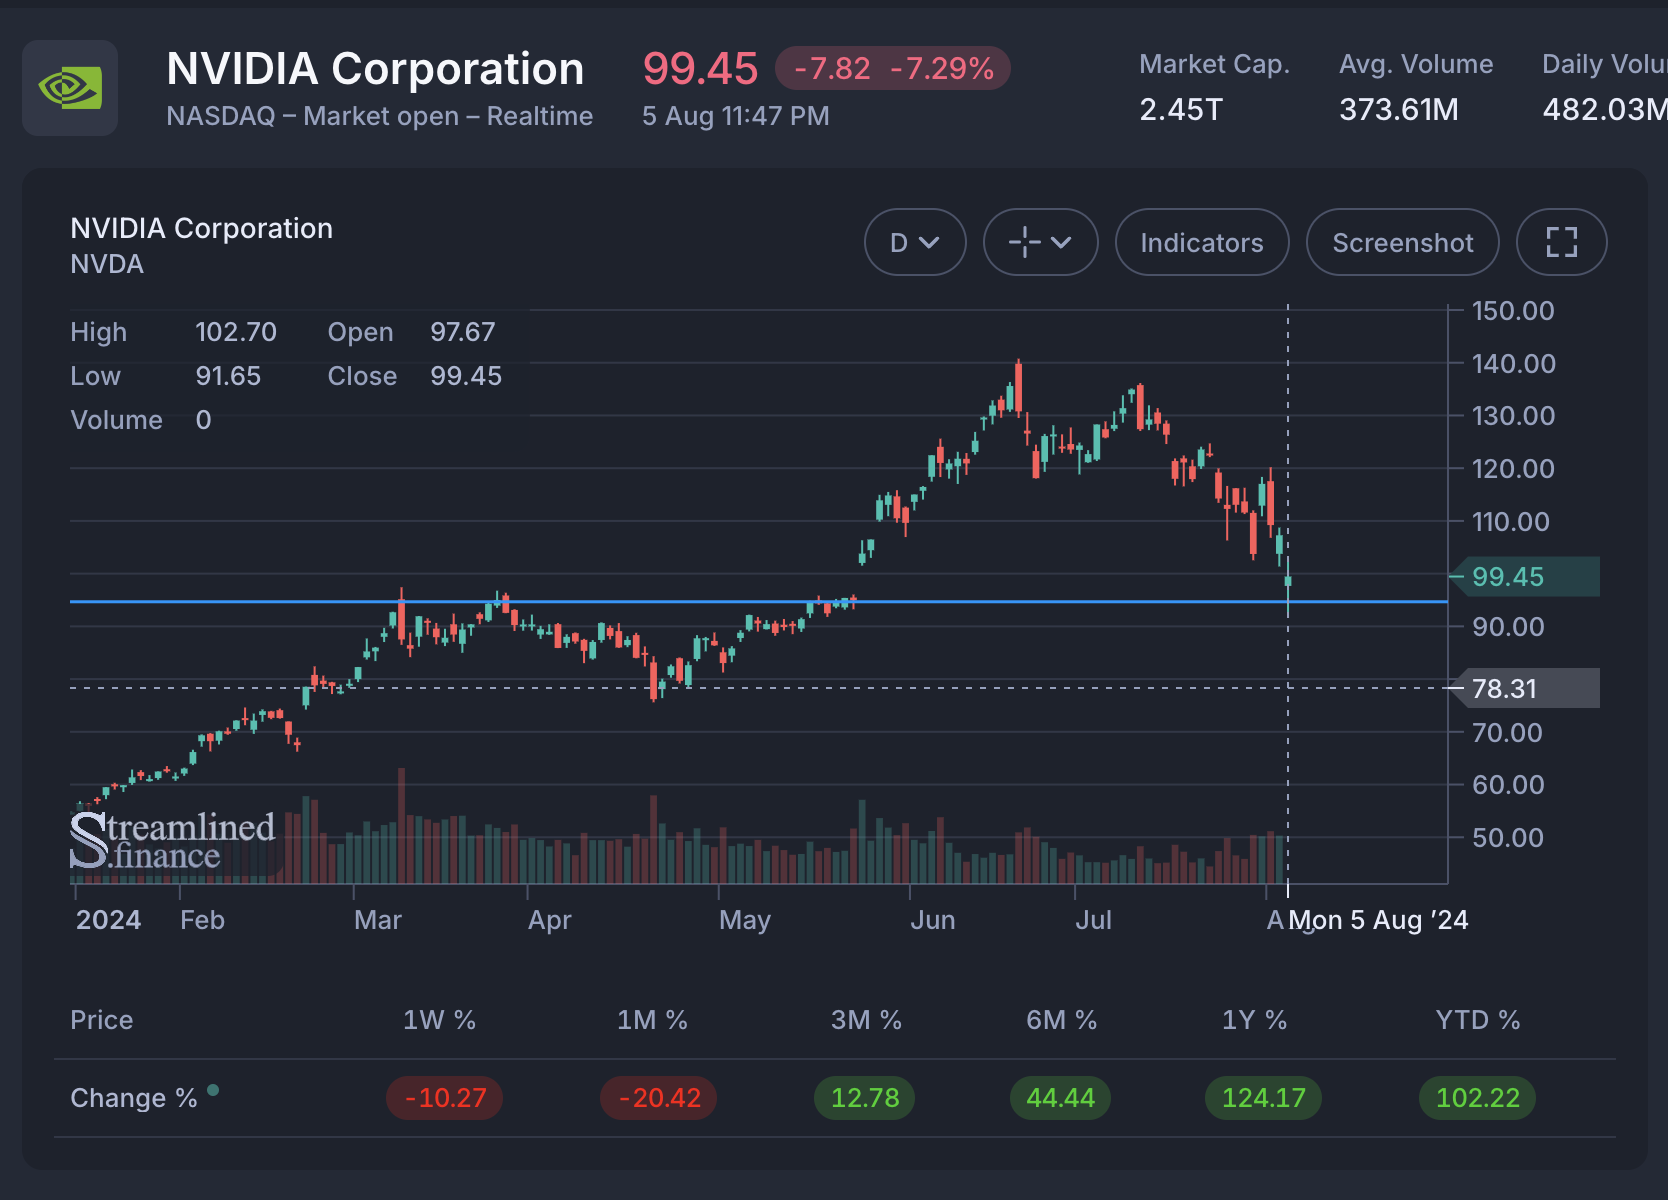
Nvidia's resistance became support -
-

Just before July it touched the moving average
-


Conclusion
Analyzing a stock involves both quantitative and qualitative assessments. By understanding a company’s business model, evaluating its financial fundamentals, and examining qualitative factors such as management strategy and competitive position, you can gain a comprehensive view of its potential as an investment.
Quantitative Analysis
Focus on key financial metrics like earnings, revenue, and free cash flow to assess the company’s performance and profitability. Metrics such as the P/E ratio, P/S ratio, and discounted cash flow (DCF) analysis help determine whether a stock is fairly valued.
Qualitative Analysis
Explore press releases, SEC filings, and management commentary to understand the company’s strategic direction, business risks, and growth outlook. AI tools can provide additional insights into these qualitative aspects, enhancing your analysis.
Valuation Considerations
Be mindful that high market cap and growth stocks often command higher valuations due to anticipated future earnings and liquidity preferences of large funds. When comparing stocks, consider these factors to avoid misleading conclusions.
What we left out of this guide is that it's important to compare your stock of interest to other stocks. If you do this over time, you'll get an increased understanding of the best businesses.
In any case, we hope that this guide was valuable and we wish you a great investing experience.
Cheers!
Team Streamlined